The Uncertainty Parameter dialog
Each parameter for which uncertainty can be specified in the form of a probability density function can be recognized by the frog legs icon ( ) next to the parameter's entry field on the respective form. An example is the Free Water Level (FWL) on the model > Fluids > Fluid Levels form. When you click on the frog legs, the Uncertainty Parameter dialog opens, which allows you to define a probability density function (PDF), amongst other settings, see image below.
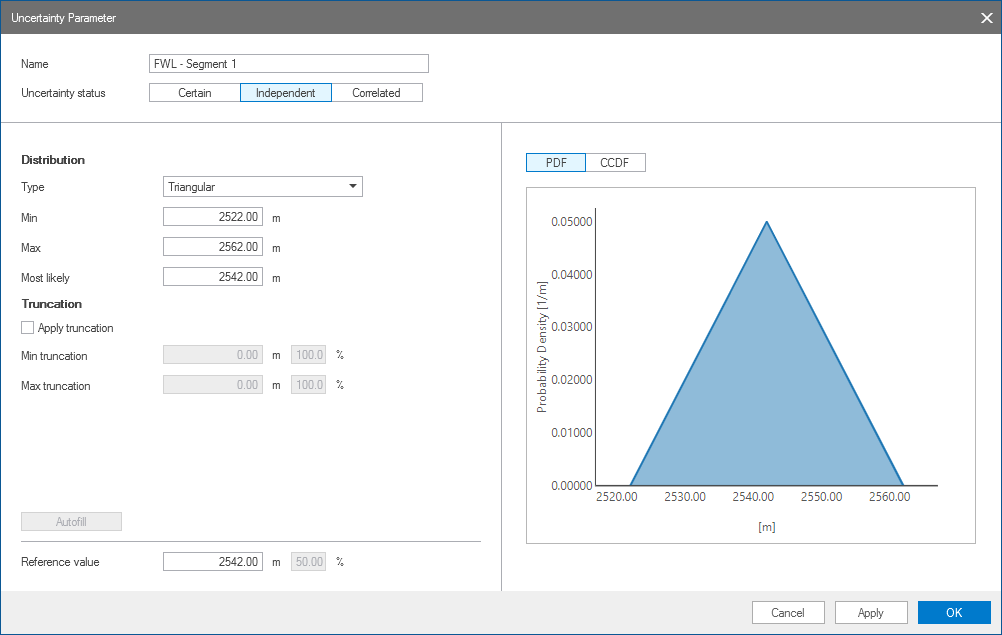
The Uncertainty Parameter dialog, which can be opened by clicking the frog legs behind a parameter's entry field on the form. The Autofill button is only available when specifying uncertainty for fluid levels (GOC or FWL). click to enlarge
The PDF that you define on the Uncertainty Parameter dialog is sampled according to the sampling strategy that you set on the Designs form of the Volumetrics Study workflow of the study strip. You can define a parameter's PDF at any stage during modeling, at an early stage when generating the respective domain model, or once all domain models are ready and you want to start an uncertainty run.
To enter the values and settings
When you click on the frog legs () , located behind a parameter's entry field on the domain model form, the Uncertainty Parameter dialog opens. The first time you open the dialog, the uncertainty status of the parameter is set to 'Certain', an indication that the parameter is not uncertain yet. To start entering settings on the dialog, first select one of the other options for the 'Uncertainty status'.
Name The name of the uncertainty parameter in the uncertainty workflow. You can overwrite it with your own name. For more information on default parameters names, see the Naming Conventions.
Uncertainty status Set the status for the selected parameter. You can choose from the following options:
- Certain - When selected, the parameter is not uncertain.
- Independent - When selected, the uncertainty parameter is an independent uncertainty parameter. The sampled value depends only on its own distribution function and truncation settings.
- Correlated - When selected, the uncertainty parameter is dependent on another (independent) uncertainty parameter. The independent uncertainty parameter is referred to as the parent uncertainty parameter, and the correlated parameter is referred to as the child uncertainty parameter. The child uncertainty parameter value is calculated based on a combination of the sampled parent value, and the correlation type, PDF and truncation settings of the child uncertainty parameter.
Depending on the selected 'uncertainty status', varying controls are available on the dialog.
![]() Correlation settings (only for correlated uncertainty parameters)
Correlation settings (only for correlated uncertainty parameters)
You use the correlation settings listed below to specify a parent uncertainty parameter and the type of correlation that exists between the parent and the child uncertainty parameters.
Keep value equal to parent's This is a straightforward one on one correlation. When you check the checkbox, the algorithm will keep the value of the child parameter equal to the parent parameter value. The correlation is automatically set to full positive.
Model Type Select a domain model type from the drop-down list to act as a filter for the list of models. If you select the All option, no filter is applied, and all domain models which contain uncertainty parameters are listed in the Model drop-down list.
Model Select a model from the drop-down list. The selected model acts as a filter for the list of parent parameters; only the independent uncertainty parameters of this model will be listed. If you select the All option, no filter is applied and all independent uncertainty parameters for the selected domain model (under 'Model type') are listed in the Parent parameter drop-down list.
Parent parameter From the drop-down list, select the uncertainty parameter that you want to use as a parent. Only independent parameters are listed. If a parameter is already used as a parent for another child, it is listed in bold. You can use an uncertainty parameter as a parent for multiple child uncertainty parameters.
Correlation Select a correlation describing the parent-child relationship. The options are:
- Full positive - When selected, the child uncertainty parameter is fully dependent on the parent. A correlation factor of +1 is assumed: when the parent uncertainty parameter value increases, so does the value for the child uncertainty parameter.
- Partial - When selected, the degree of association of the parent and the child uncertainty parameter changes. You must specify a correlation factor in the entry field below. The distribution type is set to Normal, and cannot be changed. Click here for more detailed information on the calculations (Bivariate case).
- Full negative - When selected, the child uncertainty parameter is fully dependent on the parent. A correlation factor of -1 is assumed: when the parent uncertainty parameter increases, the child decreases.
Correlation factor (Only active when Partial correlation is selected) Enter a value between (-1, +1). Although not recommended, entering a small correlation factor is allowed. Note that the correlation factor is a target, and will result in a near equal correlation coefficient to the sampled value. The difference between the correlation factor and correlation coefficient is caused by the (asymmetric) truncation of the Gaussian child uncertainty parameter PDF.
Choose the distribution type for the PDF.
Type From the drop-down list, select the distribution type for your uncertainty parameter. Select from: Uniform, Triangular, Normal, Log-normal (natural logarithm).
All controls described hereafter have form validation, which means that when you enter conflicting values (e.g. a Min value which is greater than the Average) an error is shown on the form. In case you get validation errors for values that appear correct, this can be caused by the fact that 'real' values are used for validation, and not the formatted values visible on the form. To check the 'real' values, right-mouse click on the value and choose Format, then increase the number of digits if required.
Min/Max (Only for uniform and triangular distributions) Enter the minimum and maximum values for the PDF. These values, and all values in between, can be sampled.
Most Likely (Only for triangular distributions) Enter the most likely value of the PDF. This defines the 'skewness' of the distribution.
Average (Only for normal distribution) The average of the parameter values.
Mode (Only for log-normal distribution) Refers to the most frequent value in the dataset.
Standard deviation (Only for normal distribution) The standard deviation of the parameter values. As a rule, 68.27% of the values lie within one standard deviation of the mean.
Normal standard deviation (Only for log-normal distribution) The standard deviation of ln(x). Transform the parameter values (x) by the natural logarithm (ln), then take the standard deviation. As a rule, 68.27% of the values lie within one standard deviation of the mean.
Truncation bounds the random variable from either below or above.
Min truncation Value below which the PDF is set to 0. The corresponding percentile value is shown as well. In case of log-normal distribution, make sure the value is in the log-normal domain.
Max truncation Value above which the PDF is set to 0. The corresponding percentile value is shown as well. In case of log-normal distribution, make sure the max value is in the log-normal domain.
Reference value The value used for the calculation when the parameter is not incorporated as an uncertainty parameter, for example when it is made (temporarily) inactive on the Designs form (study > Designs). The value is identical to the value on the domain model form. The corresponding percentile value is shown as well.
Click Apply to save the changes and continue working on the dialog, or click OK to save changes and close the dialog.
After you apply the numeric parameters settings in the uncertainty parameter dialog, the uncertainty parameter symbol on the domain model form will change to  for independent uncertainty parameters, and to
  for correlated (child) uncertainty parameters. Both pink symbols indicate that the parameter is uncertain and it is included in the uncertainty modeling workflow.
How to use the 'Autofill' button (fluid level uncertainty only)
The Autofill button  on the uncertainty parameter dialog is only available for Free Water Level and Gas Oil Contact as specified on the Fluid levels form (Model > Fluids > Fluid Levels). The button is enabled when all of the required fluid log information is available on the form, else, the button is grayed out. The table below gives an overview of the required fluid log information for each of the distributions (uniform, triangular, normal and log-normal) and per GOC or FWL.
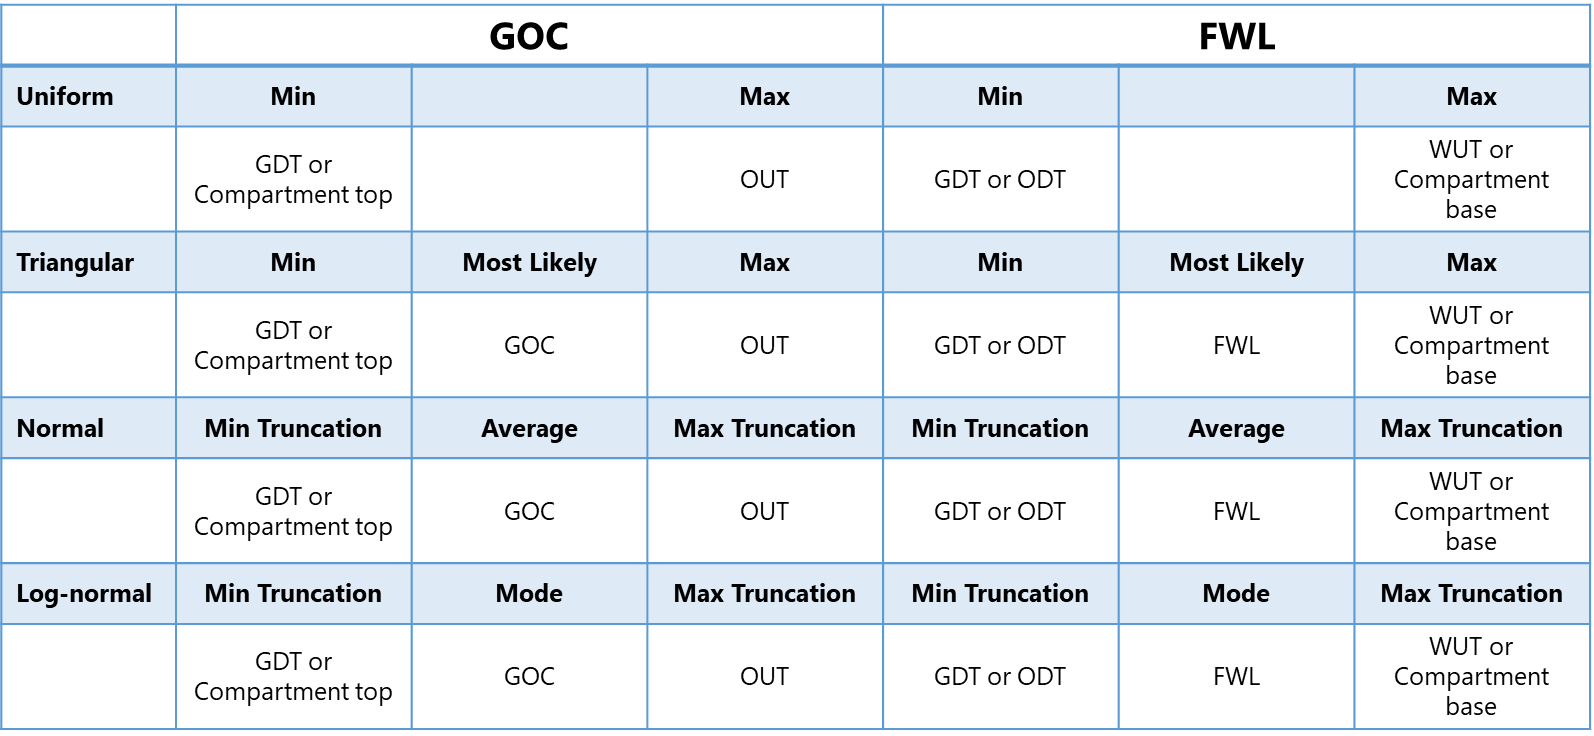
The Autofill button on the Uncertainty Parameter dialog is enabled only when the required fluid level information (GDT, ODT, WUT, etc.) is available on the form. Note that when in some occasions GDT or WUT are missing, the compartment top or compartment base are used as Min or Max value instead. click to enlarge
The Autofill applies truncation by default. The Reference value is also autofilled. The percentile value for truncation in the adjacent field is in reference to the total distribution range of the uncertainty.
Dynamic Distribution Plot
Depending on the distribution type and the numeric parameters set in the dialog, a dynamic distribution plot is available for you to visualize the probability density function (PDF) and a complementary cumulative density function (CCDF) plot. For independent or fully dependent uncertainty parameters you can read the property and probability values on the plot as you hover over the distribution curve. For partially correlated uncertainty parameters, the physical value is determined by the CDF of the child and the physical value of the parent uncertainty parameter. You cannot read it from the CCDF plot, the property values are calculated in the Implied QC Samples step of the Volumetrics Study workflow.
When the uncertainty parameter is set to be correlated, an additional Correlation plot is available. When the correlation is set to partial the plot shows 1000 randomly sampled data points from the PDFs of the parent and child uncertainty parameters. It will give you a good understanding however, of the relationship between the parameters given the current settings.
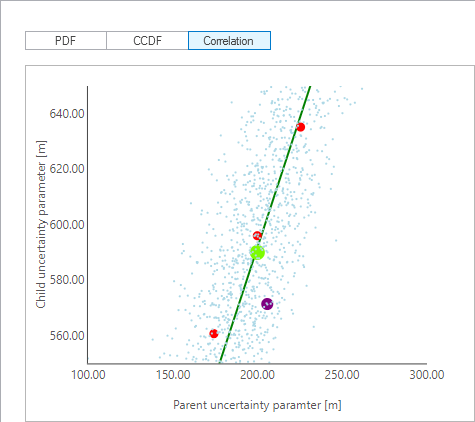
When your uncertainty parameters are set to be partially correlated, the 'Correlation' plot is a visual aid to understand the relationship between the uncertainty parameters. click to enlarge
- Light green dot - the most likely value, given the parent PDF.
- Blue dot - randomly sampled data point from the parent and child PDFs, given the correlation.
- Red dots - P90, P50 and P10, given the parent and child PDFs.
- Purple dot - Reference value of the parent and child uncertainty parameters.
- The dark green line - mean value, given the parent value, the correlation factor and the distribution of the child uncertainty parameter.
After you apply the numeric parameters settings in the uncertainty parameter dialog, the uncertainty parameter symbol on the domain model form will change to for independent uncertainty parameters, and to for correlated (child) uncertainty parameters. Both pink symbols indicate that the parameter is uncertain and it is included in the uncertainty modeling workflow.
Naming convention of uncertainty parameters
JewelSuite Subsurface Modeling has default naming convention for the uncertainty parameters when you open the uncertainty parameter dialog.
- Depth and Thickness
- Multiplier (Depth): <Multiplier - dTVD> - <surface> - <structural model>
- Multiplier (Thickness): <Multiplier - dH_H> - <surface> - <structural model>
- Facies modeling
- Variogram model: <Major Azimuth Direction - Variogram> - <facies> - <VoI> - <facies model>
- Variogram range: <Major/Minor/Vertical Range - Variogram> - <facies> - <VoI> - <facies model>
- Facies proportion: <Fraction - Target Proportions> - <facies> - <VoI> - <facies model>
- Simulation seed base: <Seed> - <facies model>
- Rock property modeling
- Transform & Trends (user-defined normal distribution): <Mean or Standard deviation> - <transformation> - <VoI> - <facies class> - <rock property model>
- Variogram model: <Major Azimuth Direction - Variogram> - <VoI> - <facies class> - <rock property model>
- Variogram range: <Major/Minor/Vertical Range - Variogram> - <VoI> - <facies class> - <rock property model>
- Conditioning: <Correlation coefficient - Conditioning> - <VoI> - <facies class> - <rock property model>
- Control method: <Value - Constant Method> - <VoI> - <facies class> - <rock property model>
- Simulation seed base: <Seed> - <rock property model>
- Fluid modeling
- Gas-Oil Contact or Free Water Level: <GOC or FWL> - <fluid compartment> - <fluid model>
- Paleo Free Water Level: <PaleoFWL> - <fluid compartment> - <fluid model>
- Oil column length: <Oil column length reference value> - <fluid compartment> - <fluid model>
- Oil column %: <Oil column % reference value> - <fluid compartment> - <fluid model>
- Fluid properties: <Bg/Bo/Rs/Rv> - <fluid compartment> - <fluid model>
- Permeability function: <PermFunc> - <custom variable> - <facies class> - <function model>
- Saturation function
- Saturation: <SHF> - <coefficient name> - <nested function name> - <function type> - <class name> - <saturation function model>
- Saturation (Paleo coefficients): <SHF> - <Value> - <coefficient name> - <nested function name> - <paleo function type> - <class name> - <saturation function model>
- Functions tool: <GF> - <coefficient name> - <function name>